Illinois out-of-state resident cannabis sales boost February totals
The Illinois Department of Financial and Professional Regulation announced today recreational cannabis sales totals for February 2024. After a dip in out-of-state resident cannabis sales in January, this category outpaced the previous month to push February’s overall total for out-of-state resident cannabis sales past January’s.
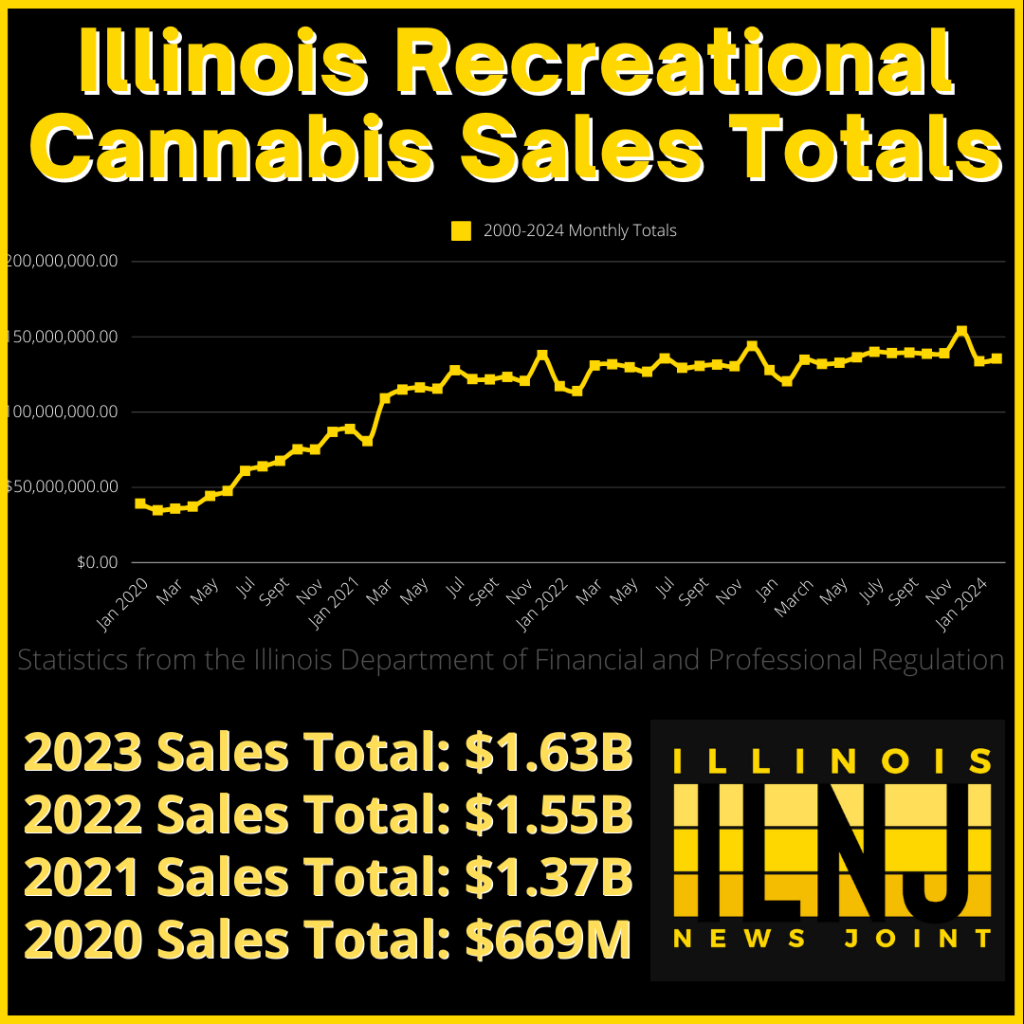
February total sales reached $135,571,931.44, which included $104,507,566.30 in-state resident sales and $31,064,365.14 out-of-state resident sales. February in-state totals were about the same as January at $104,507,566.30 and $104,048,656.70, respectively. However, February’s outpaced January out-of-state resident sales of $29,739,097.19 to top January totals of $133,787,753.89. Dispensaries sold 3,636,925 cannabis items in February.
2024 total monthly sales include:
January: $133,787,753.89
February: $135,571,931.44
2023 total monthly sales include:
January: $127,938,019.85
February: $120,488,569.91
March: $134,790,381.77
April: $131,990,502.83
May: $132,777,299.46
June: $136,408,322.07
July: $140,048,722.23
August: $139,224,010.03
September: $139,529,179.26
October: $138,751,456.09
November: $139,100,376.09
December: $153,936,703.20
2023 Yearly Totals: $1,634,983,542.79
2022 total monthly sales include:
January: $117,251,759.72
February: $113,993,046.06
March: $130,960,120.66
April: $131,782,657.26
May: $129,804,017.72
June: $126,808,907.02
July: $135,658,291.46
August: $129,441,315.80
September: $130,685,122.59
October: $131,547,030.86
November: $130,492,724.92
December: $143,899,826.30
Year totals: $1,552,324,820.37
2021 total monthly sales include:
January: $88,813,872.78
February: $80,741,641.84
March: $109,149,355.98
April: $114,961,668.22
May: $116,380,348.01
June: $115,574,741.27
July: $127,794,220.50
August: $121,933,542.23
September: $121,717,709.51
October: $123,375,372.44
November: $120,748,946.72
December: $137,896,859.11
2021 Totals: $1,379,088,278.61
2020 total monthly sales include:
January: $39,247,840.83
February: $34,805,072.01
March: $35,902,543.22
April: $37,260,497.89
May: $44,317,385.72
June: $47,646,437.25
July: $60,956,981.41
August: $63,963,846.90
September: $67,648,362.14
October: $75,278,200.15
November: $75,199,344.33
December: $86,857,898.27
2020 Totals: $669,084,410.12
These figures do not include taxes collected.
For more Illinois cannabis industry news, visit here.
To find cannabis-friendly events in Illinois, visit here.
For Illinois News Joint reviews, visit here.


