Genome-wide identification of cannabinoid biosynthesis genes in non-drug type Cannabis (Cannabis sativa L.) cultivar | Journal of Cannabis Research
Pedigree, significance, and morphology of hemp ‘Cheungsam’
Hemp Cheungsam is a variety of hemp (C. sativa) that originated from Korea (Moon et al. 2002). The variety was developed as a hybrid between the Korean local variety hemp and IH3 hemp from the Netherlands (Moon et al. 2002). As a predominant hemp variety in Korea, hemp Cheungsam has relatively low THCA is to CBDA content, resulting it to be a classified as a non-drug type Cannabis (Moon et al. 2002).
As the cultivation and consumption of Cannabis plants are highly regulated (Ransing et al. 2022), the development of Cannabis varieties is likely to be geographically restricted. Thus, in Korea, hemp Cheungsam is preferred over other local C. sativa varieties for its use in Korean traditional herbal medicine, due to its lower THCA content (Doh et al., 2019). The seeds and sprouts of hemp Cheungsam were also reported to contain compounds that are beneficial for human health such as Quercetin and Rutin, which have antioxidant and anti-inflammatory properties (Aloo et al., 2023a; Aloo et al., 2023b). Furthermore, CBDA from hemp Cheungsam has been used to enhance the anti-cancer activity of cabozantinib against hepatocellular carcinoma (Jeon et al. 2023).
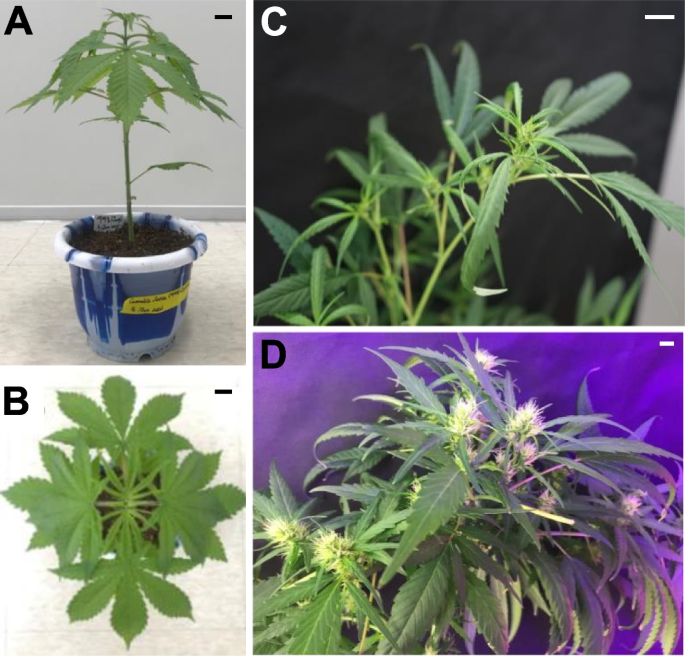
Hemp Cheungsam typically undergoes 10 to 13 weeks of vegetative growth. After which, the plant transitions to the flowering induction stage of 3 to 4 weeks. Hemp Cheungsam developed palmately compound leaves along its stem (Fig. 1A), which is similar to other varieties of C. sativa (Anderson and de la Paz 2021). Each compound leaf is made of green pinnate leaflets with serrated leaf margin (Fig. 1B). At the reproductive stage, hemp Cheungsam developed cola with female flowers, which started developing approximately 2 weeks after flower induction (Fig. 1C) and were fully developed at 5 weeks after flower induction (Fig. 1D).
Phenotype of hemp Cheungsam. A Hemp Cheungsam during the vegetative growth stage. B Top-down view of hemp Cheungsam, showing palmate leaves. C Female flowers developing at the cola at 2 w after flower induction. D Developed female flowers at the cola at 5 w after flower induction. Black (A, B) and white (C, D) scale bars, 1 cm
RNA-seq analysis of flower, leaf, and stem tissues of hemp Cheungsam
To understand the effects of gene transcription on its physiology and production of cannabinoids in different tissues of hemp Cheungsam, mature hemp plants with female flowers were dissected into flower, leaf, and stem tissues for RNA-seq analysis (Fig. 1). After removing adapter sequences and trimming low quality reads, all RNA-seq samples had more than 97% clean reads (Table 1). In addition, high Phred quality scores indicated high sequencing quality, as Q20 scores were above 97.8% and Q30 scores were above 93.3% in all samples (Table 1).
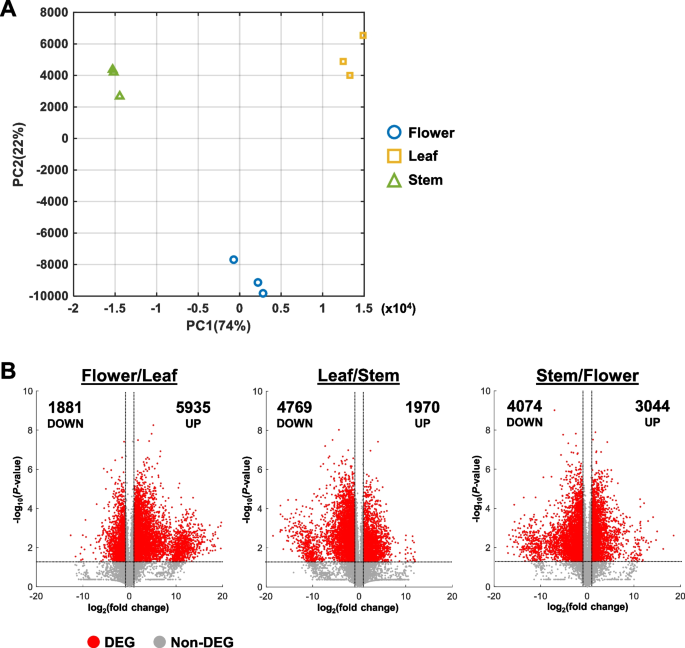
Reproducibility between replicates was verified by the Pearson correlation coefficient between samples (Fig. S1). Replicates of each tissue type showed a high correlation coefficient between replicates and a lower correlation between tissue types (Fig. S1). Similarly, samples from each tissue type formed distinct clusters in the PCA plot, suggesting that the transcriptomes of flower, leaf, and stem tissues differ greatly from each other (Fig. 2A). Furthermore, while all three tissue types varied in PC1, flower samples had distinct PC2 values from leaf and stem samples (Fig. 2A).
Comparison of transcriptomes between different tissue types. A Principal component analysis (PCA) plot of sample triplicates. PC1, principal component 1. PC2, Principal component 2. B Volcano plots for all sample comparisons. FPKM values were compared between two samples. Each volcano plot shows the distribution of fold change and Student’s t-test for all transcripts. Differentially expressed genes (DEGs) were identified with fold change > 2 or fold change P-value
Identification of differentially expressed genes (DEGs)
Genes with FPKM 2 or P-value P-value of all genes were visualized as volcano plots to better identify the transcriptomic differences between samples (Fig. 2B).
Interestingly, the most up-regulated DEGs were identified in the Flower/Leaf comparison with 5935 genes (Fig. 2B; Table 2). In comparison, the least up-regulated DEGs belonged to the Leaf/Stem comparison with 1970 genes (Fig. 2B; Table 2). In contrast, the most down-regulated DEGs were identified in the Leaf/Stem comparison with 4769 genes while the least down-regulated DEGs were from the Flower/Leaf comparison with 1881 genes (Fig. 2B; Table 2).
Identification of DEGs with specifically high- or low-expression in each plant tissue type
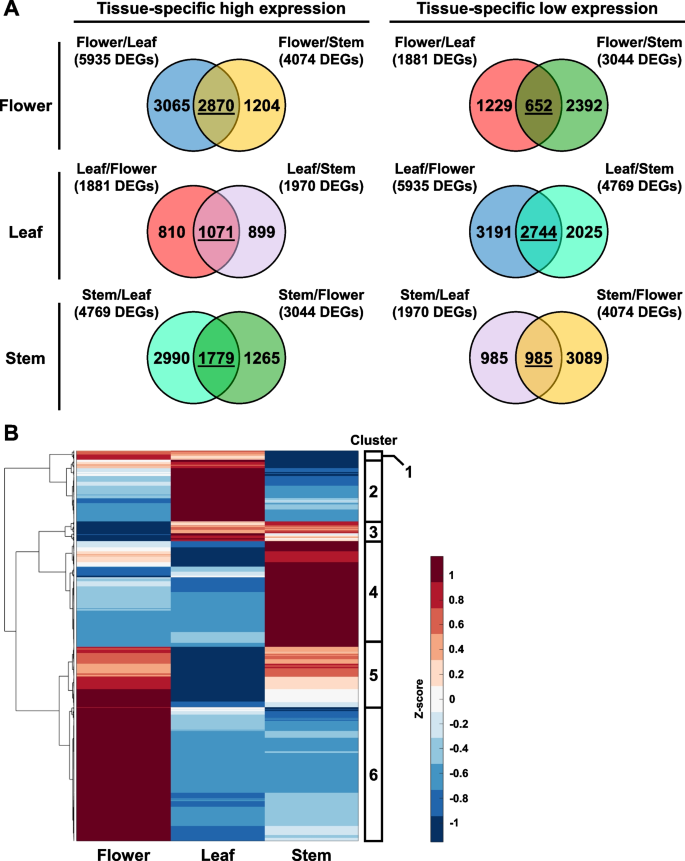
As there were three different hemp tissues in this analysis, pairwise comparisons would be unable to directly identify genes that are specifically induced or repressed in one specific tissue type. To address this limitation, the DEGs identified from each pairwise comparison were plotted into Venn diagrams. The shared DEGs in each Venn diagram represent genes that are specifically induced or repressed in each tissue type, as compared to the other plant tissues (Fig. 3A, Table S2). From this analysis, we found that flowers had the most DEGs with tissue-specific high expression and the least DEGs with tissue-specific low expression (Fig. 3A). On the other hand, leaf samples had the least DEGs with high expression and most DEGs with low expression (Fig. 3A). This corroborates with a previous study, which also showed that female Cannabis flowers have more up-regulated DEGs than other plant organs (Braich et al. 2019).
Identification of tissue-specific genes in hemp Cheungsam flower, leaf, and stem. A Venn diagrams show overlap of DEGs identified from all comparisons. DEGs shared between two comparisons are underlined. B Hierarchical clustering heatmap of shared DEGs, showing expression pattern of tissue-specific genes. Red color represents high expression while blue color represents low expression
The expression pattern of these tissue-specific DEGs was visualized in a hierarchical clustering heat map, which revealed six gene clusters (Fig. 3B, Table S3). Gene cluster 1 was enriched in the flower and leaf (Fig. 3B). Cluster 2 was specifically induced in leaf samples, while cluster 3 was up-regulated in both leaf and stem samples (Fig. 3B). Cluster 4 was enriched in only the stem, but cluster 5 was enriched in both flower and stem (Fig. 3B). Cluster 6 which is the largest gene cluster was highly expressed in only the flower samples (Fig. 3B). The highly expressed genes in flower samples may be attributed to the abundance of trichomes on female flowers, as a previous study showed overlapping expression profiles between female flowers and trichomes (Braich et al. 2019).
Tissue-specific enrichment of GO terms and KEGG pathways
Although our RNA-seq is aligned to the Cannabis sativa reference genome cs10 and other Cannabis reference genomes are available (van Bakel et al. 2011; Cai et al. 2021), GO term analysis of Cannabis genes is not readily available. As such, we performed a BLASTP search of each DEG’s protein sequence against the Arabidopsis TAIR10 database to identify close orthologs of each hemp Cheungsam gene. E-value 3, Table S4). Furthermore, gene cluster 6 had the largest number of DEGs with no Arabidopsis orthologs (No Hit, Table 3), indicating that flower samples may express more genes that are unique to Cannabis.
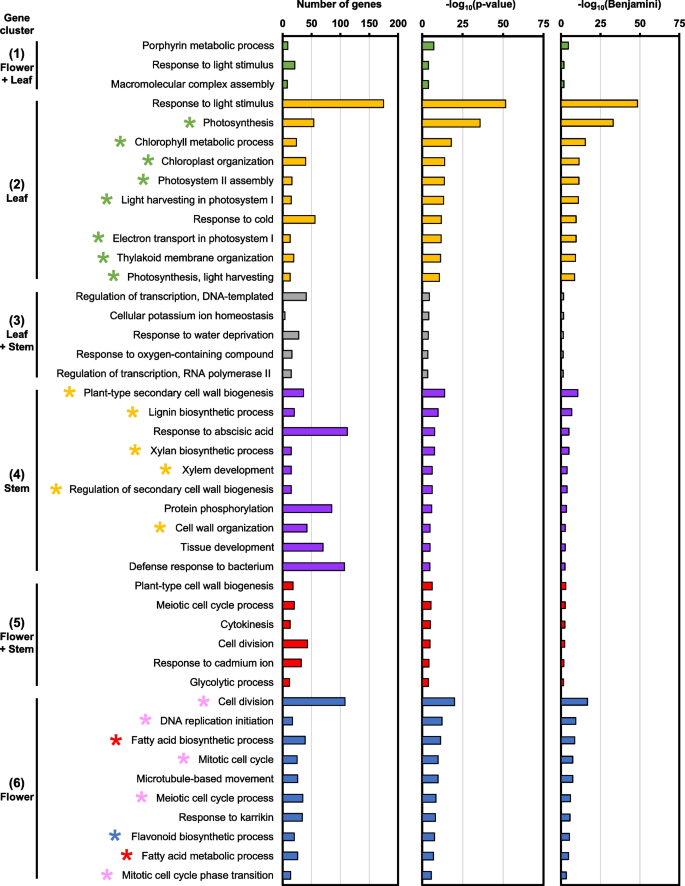
The Arabidopsis orthologs are subsequently used to identify biological process (BP) GO terms that are specifically induced in each gene cluster (Table S5). Gene cluster 2 consists of DEGs that were highly expressed in leaf samples, which corresponded with GO terms related to photosynthesis and chloroplasts, such as “photosynthesis” and “chlorophyll metabolic process” (green stars, Fig. 4). In contrast, gene cluster 4 comprises of DEGs with high expression in stem samples and were enriched in GO terms related to plant cell wall and vasculature development, including “plant-type secondary cell wall biogenesis” and “xylem development” (yellow stars, Fig. 4). Importantly, gene cluster 6 contains DEGs that were enriched in flowers and were related to GO terms involved in fatty acid biosynthesis and metabolism (red stars, Fig. 4). GO terms related to cell division were also identified in cluster 6, such as “meiotic cell cycle process” and “mitotic cell cycle” (pink stars, Fig. 4). Interestingly, the “flavonoid biosynthetic process” GO term was also found to be specific to flower samples (blue star, Fig. 4). While GO terms were also identified in gene clusters 1, 3, and 5, which were expressed in multiple tissue types, their enrichment was less significant (Fig. 4).
Furthermore, the Arabidopsis orthologs were used to identify KEGG pathways from each gene cluster (Table S6). Leaf-specific DEGs in gene cluster 2 were associated with KEGG pathways related to photosynthesis like “photosynthesis – antenna proteins” and “carbon fixation in photosynthetic organisms” (green stars, Fig. S2). Interestingly, stem-specific DEGs in cluster 4 were related to “phenylpropanoid biosynthesis” and “stilbenoid, diarylheptanoid, and gingerol biosynthesis” (yellow stars, Fig. S2). DEGs in gene cluster 5, which were up-regulated in the flower and stem, were involved in amino acid metabolism such as “biosynthesis of amino acids” and “alanine, aspartate, and glutamate metabolism” (light blue stars, Fig. S2). Moreover, KEGG pathways related to “carbon metabolism” and “glycolysis/gluconeogenesis” were also identified in cluster 5 (pink stars, Fig. S2). Lastly, KEGG pathways that are specific to flower samples in gene cluster 6 were related to “fatty acid biosynthesis/metabolism” (red stars) as well as “flavonoid biosynthesis” (blue star, Fig. S2). Conversely, gene clusters 1 (up-regulated in flower and leaf) and 3 (up-regulated in leaf and stem) did not correlate to any biologically meaningful KEGG pathway (Fig. S2).
Analysis of cannabinoid biosynthetic pathway in each tissue type of hemp Cheungsam
While both GO term and KEGG pathway analyses identified fatty acid biosynthesis and metabolism to be specifically enriched in flowers of hemp Cheungsam, the analyses did not identify cannabinoid biosynthesis. This can be explained by the lack of Arabidopsis orthologs for cannabinoid biosynthetic pathway genes and the relative exclusivity of cannabinoid biosynthesis to a small number of organisms. While cannabinoid biosynthesis was initially thought to be specific to C. sativa, it is now known that other plants, such as Rhododendron dauricum and Radula marginata, also have cannabinoid biosynthetic pathway genes (Gülck and Møller 2020).
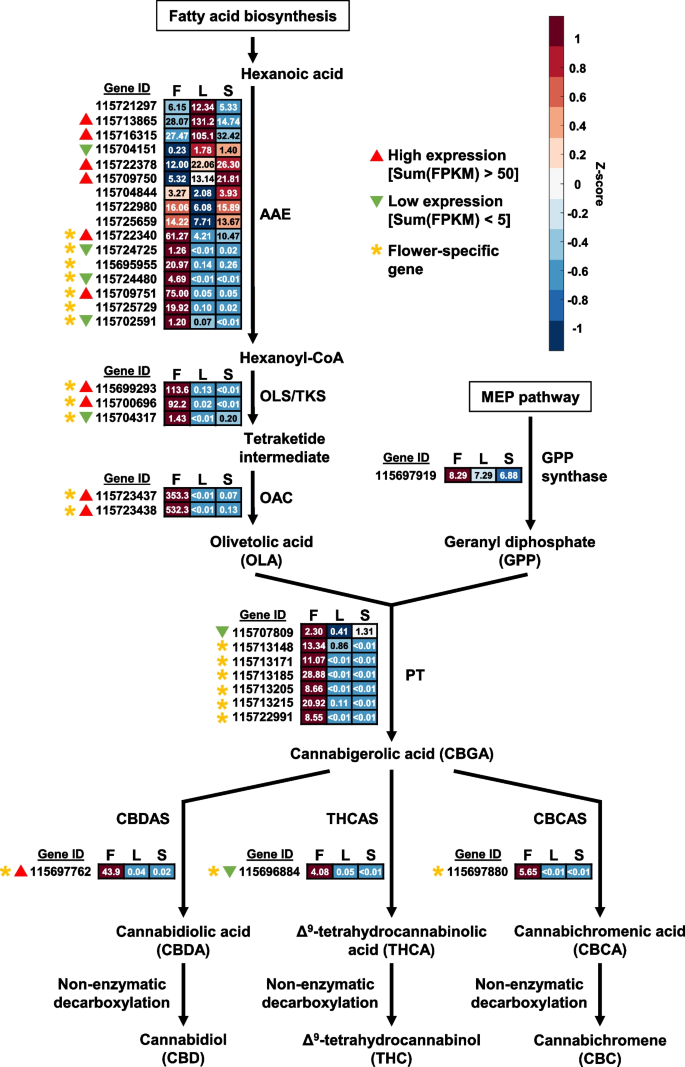
In hemp Cheungsam, many of the cannabinoid biosynthetic pathway genes were specifically expressed in the flowers (Fig. 5, Table S7). These include orthologs of genes encoding acyl-activating enzyme (AAE), olivetol synthase (OLS)/tetraketide synthase (TKS), olivetolic acid cyclase (OAC), and aromatic prenyltransferase (PT), which are responsible for generating the precursors for cannabinoid production (Fig. 5). Interestingly, 7 out of the 16 AAE orthologs in hemp Cheungsam were specifically expressed in the flowers as compared to other tissues (Fig. 5), indicating that these AAEs are crucial for cannabinoid biosynthesis. In contrast, the C. sativa marijuana cultivar Purple Kush displayed similar expression levels of AAE1 and AAE3 in stems, flowers, and other plant tissues (van Bakel et al. 2011). This suggests that gene expression patterns in hemp Cheungsam may differ from other varieties of C. sativa. The expression of all downstream genes OLS/TKS, OAC, PT, and CBDA/THCA/CBCA synthases (CBDAS, THCAS, and CBCAS) were highly specific to the flowers, indicating that cannabinoid biosynthesis occurs mostly in the flowers of hemp Cheungsam (Fig. 5). This is consistent with the transcriptome of C. sativa Purple Kush (van Bakel et al. 2011) and in agreement with the knowledge that cannabinoid biosynthesis predominantly occurs in the glandular trichomes of female flowers of Cannabis (Zager et al. 2019).
Expression of full-length cannabinoid biosynthetic pathway genes in various hemp Cheungsam plant tissues. Expression levels are represented by both Z-score and FPKM value. Red color indicates high Z-score while blue color indicates low Z-score. Each row represents a gene homolog. The number in each box represents FPKM value. Sum(FPKM) refers to total FPKM from flower, leaf, and stem samples. Flower-specific gene is defined as expression in flowers samples being more than five-fold than leaf or stem samples. AAE, ACYL-ACTIVATING ENZYME. OLS/TKS, OLIVETOL SYNTHASE/TETRAKETIDE SYNTHASE. OAC, OLIVETOLIC ACID CYCLASE. PT, AROMATIC PRENYLTRANSFERASE. CBDAS, CBDA synthase. THCAS, THCA synthase. CBCAS, CBCA synthase. F, flower. L, leaf. S, stem
While most cannabinoid biosynthetic pathway genes are specific to flowers, we noted that the overall expression levels may vary between orthologs. For example, OLS/TKS orthologs 115699293 and 115700696 have high FPKM values, while unigene 115704317 has low expression even in the flowers (Fig. 5). This suggests that unigenes 115699293 and 115700696 are likely to be the main OLS/TKS orthologs in hemp Cheungsam. By comparing the total FPKM value across all tissue types (flower, leaf, and stem), orthologs with high and low expression levels were identified (Fig. 5). Orthologs with high expression were found for AAE, OLS/TKS, and OAC, while GPS showed moderate expression (Fig. 5). In contrast, all 7 PT showed either moderate or low expression (Fig. 5). Downstream of CBGA, only the CBDAS ortholog showed high expression (Fig. 5). In contrast, the THCAS/CBCAS orthologs displayed moderate or low expression (Fig. 5). Taken together, this suggests that cannabinoid biosynthesis in hemp Cheungsam favors CBDA production over THCA and CBCA, which is consistent with a previous report showing high CBDA and low THCA content (Moon et al. 2002).
Analysis of cannabinoid biosynthetic pathway genes
Acyl-activating enzyme (AAE)
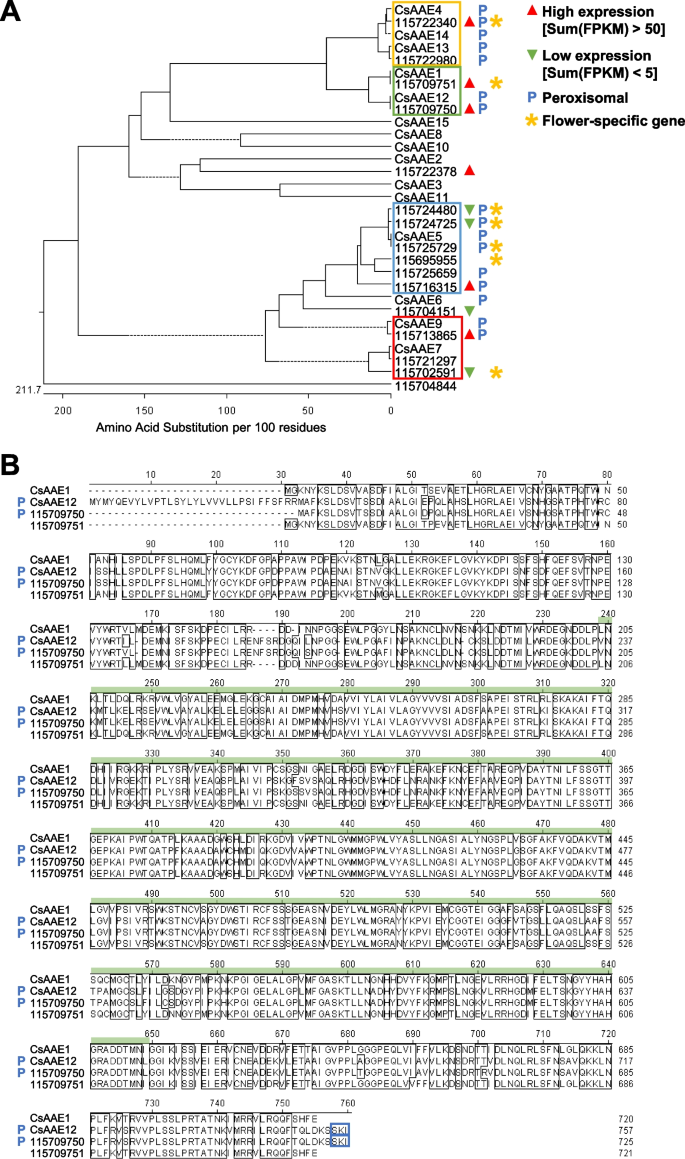
The synthesis of cannabinoids begins with the conversion of hexanoic acid to short-chain fatty acyl-coenzyme A (CoA) precursor hexanoyl-CoA by AAE (Stout et al. 2012). Hemp Cheungsam has 16 AAE gene orthologs, which showed high protein homology to known AAE genes from the GenBank database (Fig. 6A). Only unigene 115704844 was phylogenetically distant from the other AAE genes (Fig. 6A). CsAAE1 was previously suggested to be a hexanoyl-CoA synthase involved in the cannabinoid biosynthetic pathway, based on its high expression in glandular trichomes, hexanoyl-CoA synthase activity, and subcellular localization to the cytoplasm (Stout et al. 2012). As the subsequent step (polyketide biosynthesis) in the cannabinoid biosynthetic pathway occurs in the cytoplasm, AAEs that localize to the peroxisome are implied to be involved in peroxisomal β-oxidation (Shockey et al., 2003; De Azevedo Souza et al., 2008; Stout et al. 2012).
AAE orthologs in hemp Cheungsam. A Phylogenetic tree of hemp Cheungsam and GenBank database AAE protein sequences. Solid lines indicate actual phylogenetic distance. Dotted lines are used to align all terminals and do not represent phylogenetic distance. Colored boxes indicate four main groups of AAE identified in the phylogenetic tree. Sum(FPKM) refers to total FPKM from flower, leaf, and stem samples. B Multiple protein sequence alignment of CsAAE1 and CsAAE12 with hemp Cheungsam orthologs. Green bar, AMP-binding domain. Blue boxes highlight C-terminus peroxisome targeting signal type 1 (PTS1; Reumann 2004). Blue P indicates predicted peroxisomal AAE
As hemp Cheungsam unigene 115709751 showed high protein sequence similarity to CsAAE1, we performed multiple sequence alignment to compare their protein sequences with the nearest homologs CsAAE12 and unigene 115709750 (green box, Fig. 6A). Multiple sequence alignment revealed that CsAAE1, CsAAE12, 115709750, and 115709751 shared high homology in the AMP-binding domain (Fig. 6B), which is required to activate the carboxylic acid substrate (e.g. hexanoate) to form adenylate as an acyl-AMP intermediate (Shockey and Browse 2011). In addition to their high similarity, both CsAAE12 and 115709750 have the previously reported C-terminus peroxisome targeting signal type 1 (PTS1) sequence (blue boxes, Fig. 6B; Reumann 2004; Stout et al. 2012), suggesting that they localize to the peroxisome. In contrast, 115709751 does not and likely localizes to the cytoplasm, similar to CsAAE1 (Stout et al. 2012). The presence of PTS1 was further confirmed using the PTS1 predictor (Neuberger et al. 2003), while the subcellular localization was further verified using WoLF PSORT prediction (Horton et al., 2007).
We further analyzed the multiple sequence alignments amongst each group of AAE homologs (yellow, blue, red boxes, Fig. 6A). Multiple sequence alignments showed that the other AAE groups contain the AMP-binding domain and AMP-binding C-terminal domain (Fig. S3, S4, S5). The C-terminus PTS1 sequence and peroxisomal localization was also identified in CsAAE4, CsAAE13, CsAAE14, 115722340, and 115722980 (Fig. S3), which corroborates with a previous study showing CsAAE13 and CsAAE14 having the PTS1 sequence (Stout et al. 2012). As for homologs of CsAAE5, all homologs except 115695955 were predicted to contain the PTS1 sequence and localize to the peroxisome (Fig. S4). Lastly, the comparison between CsAAE7, CsAAE9, 115721297, 115702591, and 115713865 revealed that both CsAAE9 and 115713865 contain the PTS1 sequence for the peroxisome localization (Fig. S5). As for other AAE homologs, only CsAAE6 was predicted to have both PTS1 and peroxisomal localization (Fig. 6A). Taken together, the results imply that 115709751 is the major AAE ortholog in hemp Cheungsam, with high expression that is specific to the flowers and no predicted peroxisomal localization (Fig. 6A).
Olivetol synthase (OLS)/tetraketide synthase (TKS)
Hexanoyl-CoA undergoes sequential condensation with three malonyl-CoA, which is catalyzed by OLS/TKS to form a linear tetraketide intermediate followed by further conversion to OLA or olivetol depending on the presence or absence of OAC, respectively (Kearsey et al. 2020).
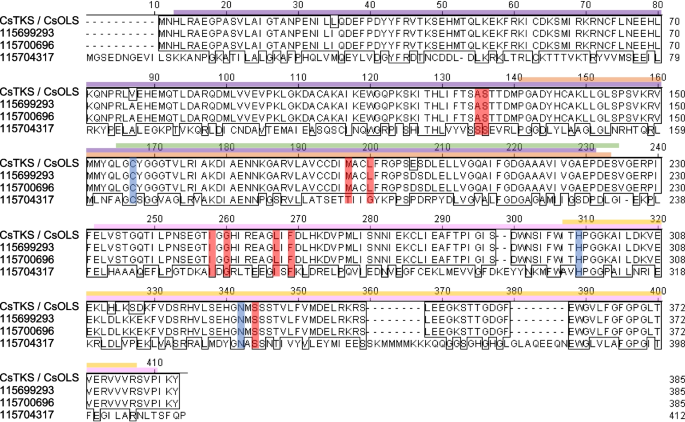
From the RNA-seq data set, we identified three putative OLS/TKS genes (unigenes 115699293, 115700696, and 115704317). Among them, 115699293 and 115700696 matched 100% to each other at the amino acid sequence level (Fig. 7), but not at nucleotide sequence level (Fig. S6), indicating two copies of this gene at different loci in hemp Cheungsam. These genes also showed 98.4% amino acid sequence similarity to the database OLS/TKS (CsTKS/CsOLS; Fig. 7). On the other hand, 115704317 showed low protein homology with these sequences, with 36.6% similarity to CsOLS and 37.3% similarity to 115699293 and 115700696.
OLS/TKS orthologs of hemp Cheungsam. A Multiple protein sequence alignment of CsOLS/CsTKS with hemp Cheungsam orthologs. Purple bar, Chalcone and stilbene synthase N-terminal domain. Pink bar, Chalcone and stilbene synthase C-terminal domain. Green bar, 3-Oxoacyl-[acyl-carrier-protein (ACP)] synthase III domain. Yellow bar, ACP synthase C-terminal domain. Orange bar, FAE1/Type III polyketide synthase-like domain. Based on Taura et al. (2009), CHS catalytic triad residues are highlighted in blue, while residues that may be important for substrate specificity or polyketide length are highlighted in red
Conserved domain search associated these OLS/TKS homologs with the chalcone synthase (CHS) superfamily, as N-terminal and C-terminal domains of chalcone and stilbene synthase were identified (Fig. 7). Moreover, other domains related to 3-oxoacyl-[acyl-carrier-protein (ACP)] synthase III and FAE1/Type III polyketide synthase-like protein were found in OLS/TKS homologs (Fig. 7). The identification of CHS-related domains found in OLS/TKS homologs can be explained by their high sequence similarity, as seen in the comparison between C. sativa OLS/TKS and Medicago sativa CHS (Taura et al. 2009). The comparison between CHS and OLS identified three conserved catalytic residues (Cys157, His297, Asn330; positions in CsOLS) for chain elongation and nine active site residues (Ala125, Ser126, Met187, Leu190, Ile248, Gly250, Leu257, Phe259, Ser332; positions in CsOLS) for substrate specificity (Fig. 7; Taura et al. 2009). All these residues were conserved in CsOLS as well as in unigenes 115699293 and 115700696 (Fig. 7), suggesting that 115699293 and 115700696 are OLS/TKS homologs in hemp Cheungsam. In contrast, the catalytic residues were conserved in 115704317 but 4 out of 9 substrate-specificity residues differ from CsOLS (Fig. 7). This suggests that while 115704317 may be catalytically similar to OLS, it likely functions as a polyketide synthase (PKS) that targets other substrates besides hexanoyl-CoA and produces polyketides of different length (Jez et al. 2000).
Olivetolic acid cyclase (OAC)
The linear tetraketide intermediate is further cyclized by OAC to produce OLA (Kearsey et al. 2020). Here, we identified two OAC orthologs (unigenes 115723437, 115723438) that matched 100% to the GenBank database CsOAC protein sequence (Fig. S7A). Interestingly, the nucleotide sequences of both hemp OAC homologs showed slight differences from the GenBank database nucleotide sequence (Fig. S7B). This suggests that hemp Cheungsam may have a single OAC gene with multiple transcript variants or two highly conserved genes.
CsOAC, 115723437, and 115723438 contain the stress-responsive dimeric α + β barrel (DABB) domain (Fig. S7), which makes them structurally similar to other polyketide cyclases (Gagne et al. 2012). Enzymatic assay of DABB domain-containing OAC from C. sativa trichomes showed the conversion of hexanoyl-CoA to OLA, in the presence of OLS/TKS (Gagne et al. 2012). This indicates that the conserved DABB domain plays a significant role for OLA production.
Aromatic prenyltransferase (PT)
OLA reacts with GPP to undergo prenylation by PT, resulting in the biosynthesis of CBGA (Blatt-Janmaat and Qu 2021). The RNA-seq elucidated 7 putative PT in hemp Cheungsam. In C. sativa, CsPT1 and CsPT4 were previously identified to be key players in the biosynthesis of CBGA from OLA and GPP (Lim et al. 2021). In contrast, CsPT2 was categorised as a clade II PT, which was shown to be involved in tocopherol biosynthesis (Collakova and DellaPenna, 2001, Rea et al. 2019). Moreover, while CsPT3 belonged to the same phylogenetic clade as CsPT1 and CsPT4, it was demonstrated to function in Cannflavin A and B biosynthesis in C. sativa (Rea et al. 2019).
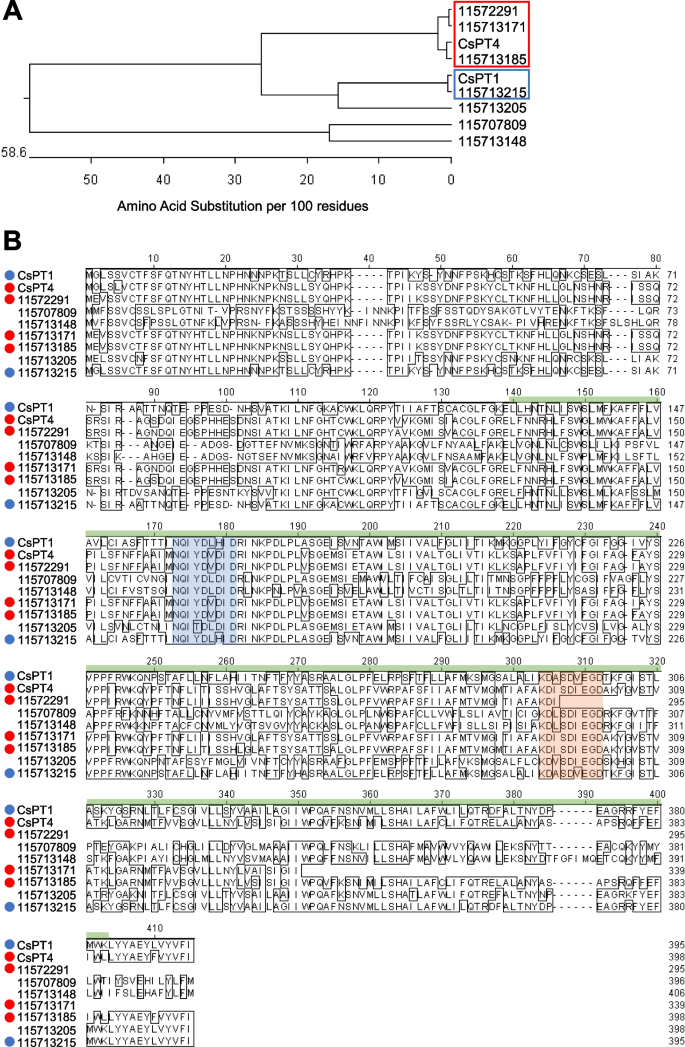
Phylogenetic analysis of hemp Cheungsam PT orthologs against GenBank database CsPT1 and CsPT4 revealed high protein similarity between CsPT1 with unigene 115713215 (blue box, Fig. 8A). In addition, CsPT4 formed a distinct clade with unigenes 115722991, 115713171, and 115713185 (red box, Fig. 8A).
PT orthologs in hemp Cheungsam. A Phylogenetic tree of protein sequences of CsPT1, CsPT4, and hemp Cheungsam PT orthologs. Red and blue boxes indicate close orthologs of CsPT4 and CsPT1, respectively. B Multiple sequence alignment of all sequences in (A). Highlighted sequences are conserved PT motifs: NQxxDxxxD (blue), KDxxDxxGD (orange) (de Bruijn et al. 2020). Green bar, UbiA domain. CsPT1 ortholog, blue circle. CsPT4 ortholog, red circle
Further sequence alignment was carried out for CsPT1, CsPT4, and all PT orthologs, which indicated a generally conserved UbiA prenyltransferase domain in CsPT1, CsPT4, and all high similarity orthologs (red and blue dots, Fig. 8B). The UbiA superfamily proteins are characterized as intramembrane PT that function in various biological functions such as chlorophyll biosynthesis, tocopherol biosynthesis, and secondary metabolism to produce phytoalexins and alkaloids for plant defense (Li 2016). CsPTs, which are homogentisate (HG) PTs, typically contain the conserved aspartate-rich motifs, NQxxDxxxD and KDxxDxxGD (de Bruijn et al. 2020). Interestingly, all putative PT genes in hemp Cheungsam contain the NQxxDxxxD motif (blue region, Fig. 8), but the KDxxDxxGD motif was missing from 115722991 (orange region, Fig. 8). These motifs function in regulating Mg2+ ions that stabilize the pyrophosphate component of prenyl donors for further reaction (de Bruijn et al. 2020). Also, PTs from the HG family have been shown to localize in the plastids (Sukumaran et al. 2018; Yang et al. 2018). As unigenes 115713171, 115713185, and 115713215 (Fig. 8) have high homology with CsPT1/4 and contain the conserved aspartate-rich motifs, it is possible that they are functional aromatic PTs that catalyze the conversion of OLA to CBGA in hemp Cheungsam.
Cannabinoid oxidocyclase (CBCAS, CBDAS, THCAS)
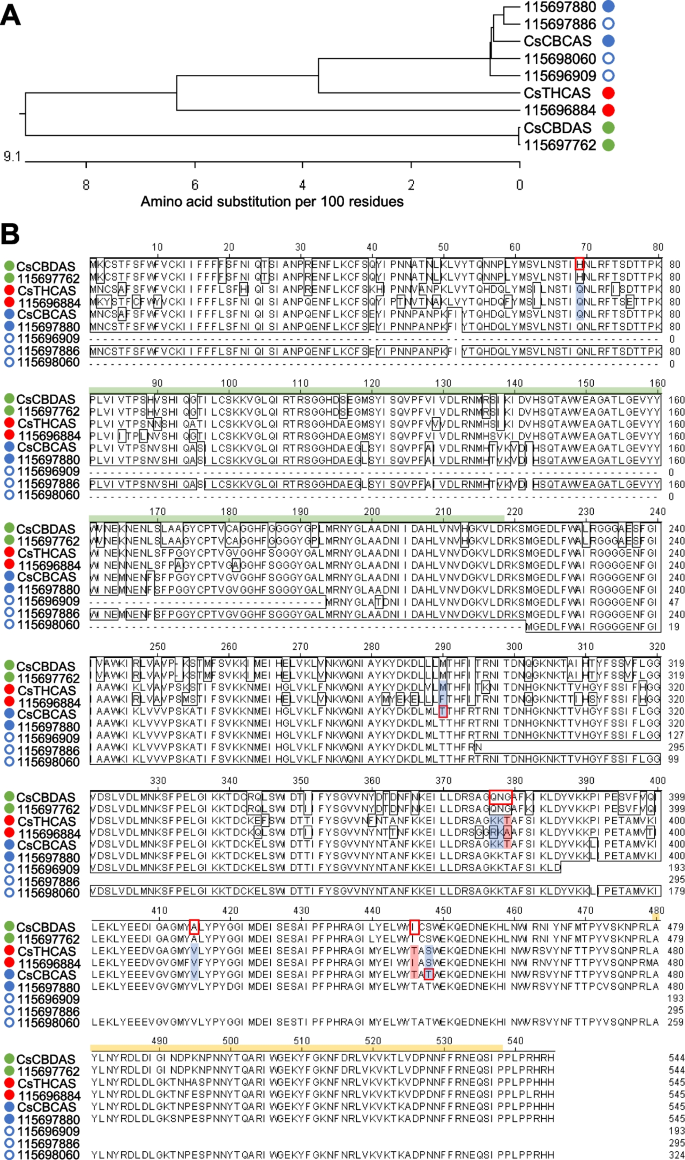
CBCAS, CBDAS, and THCAS are cannabinoid oxidocyclases that use CBGA as a substrate for the conversion to CBCA, CBDA and THCA (Jalali et al. 2019; Melzer et al. 2022). The RNA-seq data set has elucidated the following putative genes: four CBCAS, one THCAS, and one CBDAS (Fig. 9A). Multiple sequence alignment of the protein sequences showed that GenBank CsCBCAS shared high protein homology with unigenes 115696909, 115697880, 115697886, and 115698060 (Fig. 9B). Moreover, CsCBDAS matched 100% to unigene 115697762 (Fig. 9A, B). As unigene 115696884 showed high similarity to both CsCBCAS (87.9%) and CsTHCAS (89.0%) (Fig. 9A), further sequence analysis was needed to elucidate its function and identity.
Cannabinoid oxidocyclase orthologs of hemp Cheungsam. A Phylogenetic tree of protein sequences of CsCBCAS, CsCBDAS, and CsTHCAS with orthologs. B Multiple sequence alignment of all sequences in (A). Green bar, FAD-binding domain. Yellow bar, BBE-like domain. Blue circle, CBCAS homolog. Green circle, CBDAS homolog. Red circle, THCAS homolog. Closed circles represent full-length sequences with stop codons. Open circles represent partial sequences
CBDAS, THCAS, and CBCAS are known to belong to the Berberine Bridge Enzyme (BBE)-like gene family (Sirikantaramas et al. 2004). CBDAS, THCAS, and CBCAS also feature conserved domains of the BBE-like family, including the Flavin Adenin Dinucleotide (FAD) binding domain and a C-terminal BBE-like domain (Fig. 9B; van Velzen and Schranz, 2021). These two main domains (FAD-binding domain and BBE-like domain) were found in most of cannabinoid oxidocyclase orthologs of hemp Cheungsam (Fig. 9B). However, N-terminal truncation resulted in unigenes 115696909 and 115698060 lacking the FAD-binding domain, while C-terminal truncation resulted in unigenes 115696909 and 115697886 lacking the BBE-like domain (Fig. 9B), suggesting that these unigenes are partial sequences and do not correspond to functional cannabinoid oxidocyclases. All other hemp Cheungsam cannabinoid oxidocyclase sequences were highly conserved with CBDAS, THCAS, or CBDAS, suggesting that they are full-length oxidocyclases (Fig. 9B). However, it is important to note that expression of the full-length oxidocyclase homologs were different, as unigene 115697762 (CBDAS homolog) showed more than seven-fold higher expression than unigenes 115696884 (THCAS homolog) and 115697880 (CBCAS homolog) (Fig. 5). This was consistent with the high CBDA and low THCA content of hemp Cheungsam (Moon et al. 2002).
To elucidate the identity of 115696884, we compared specific amino acid residues at the shared active site between CsCBDAS, CsTHCAS, and CsCBCAS as identified by Lim et al. (2021). While CsCBDAS, CsTHCAS, and CsCBCAS share a generally similar amino acid sequence, specific residues at the active site may be used to differentiate between the cannabinoid oxidocyclases (red boxes, Fig. 9B; Lim et al. 2021). The multiple sequence alignment indicated that these amino acid residues in 115696884 were mostly similar to CsTHCAS, including exact matches at Gln69, Lys378, Val415, and Ser448 (blue highlights, Fig. 9B). Other residue changes in 115696884 were of similar chemical properties as CsTHCAS: Phe290 (115696884) was non-polar like Met290 (CsTHCAS), while Arg377 (115696884) had a positively charged side chain like Lys377 (CsTHCAS) (blue highlights, Fig. 9B). Besides these, 115696884 had two other residue changes that did not match CsTHCAS: Ala379 to Thr379 and Ile446 to Thr446 (red highlights, Fig. 9B). In contrast, 115696884 had three mismatches to CsCBCAS: Phe290 to Thr290, Ala379 to Thr379, and Ile446 to Thr446 (Fig. 9B). These amino acid differences suggest that unigene 115696884 may function more closely to CsTHCAS. Furthermore, the small but detectable amount of THCA in hemp Cheungsam (0.34%, Moon et al. 2002) suggests that unigene 115696884, despite its relatively low expression in flowers (Fig. 5), may be a functional but low-activity THCAS. However, further work is required to investigate if unigene 115696884 functions as a THCAS or other cannabinoid oxidocyclase.


