State licenses for medical marijuana dispensaries: neighborhood-level determinants of applicant quality in Missouri | Journal of Cannabis Research
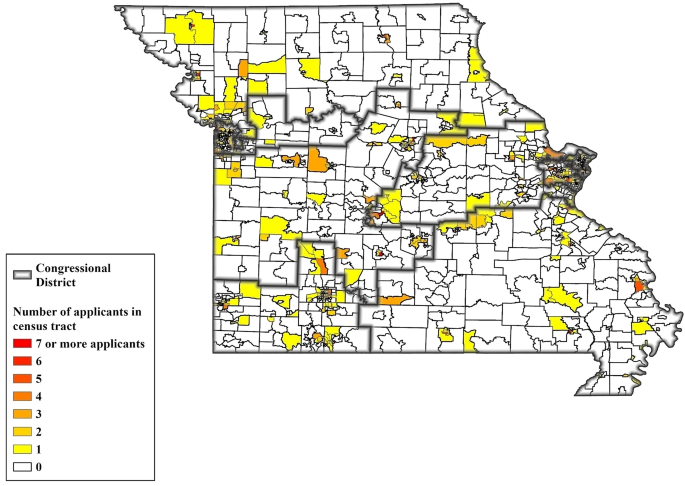
Out of the 1,654 census tracts in Missouri, a total of 606 (or 36.6%) contained the physical location of at least one proposed site for a marijuana dispensary during the state’s review of applications. While 1,201 dispensary applications were submitted to MODHSS, only 192 licenses (or 16%) were approved. Figure 1 displays a map of census tracts in Missouri where applications for state licenses proposed the opening of marijuana dispensaries. Out of Missouri’s 1,654 census tracts, a total of 1,048 census tracts were not included in applications whereas 606 census tracts were listed as potential sites for the pool of 1,201 applicants. For census tracts included in dispensary applications, the most common numbers of dispensary site proposals were “1” (n = 343) and “2” (n = 125). There were 263 census tracts with two or more applicants. At the upper end of the distribution, a total of 16 census tracts were included in “7 or more” applications, which included one census tract with a maximum value of 17 applicants.
Definitions for each application category and descriptive statistics for the highest scores from each census tract are provided in Table 1. Sample means were stratified according to whether or not a census tract had at least one applicant approved for a license. For the whole application, the average maximum score was 79.4% in census tracts where dispensaries were approved. In other census tracts, the average maximum score was 69.5%. Two categories that tended to generate the lowest scores among top applicants were Security and Economic Impact, which had average maximum scores of 67.7% and 70.3%, respectively, where licenses were approved. For census tracts with only rejected applicants, the average maximum scores were significantly lower with values of 52.9% for Security and 58.2% for Economic Impact. The categories with the highest scores included Character, Experience, and Competition. For each of these categories, the average maximum score exceeded 90%.
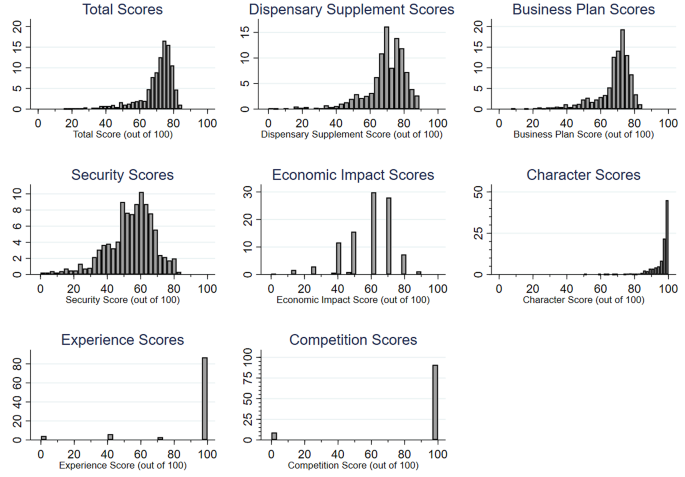
Visualizations for the entire distribution of scores among all 1,201 applicants are shown in Fig. 2. The distribution of Total Scores, which combined all categories, ranged from 15.1 to 85% with a median score of 73.2%. Most rubric categories resulted in a distribution of scores with considerable variation across applicants. The distribution of scores in the Dispensary Supplement and Business Plan sections each displayed a close resemblance to the distribution of Total Scores. However, the Experience and Competition categories generated little variation in the applicant pool as most applicants received perfect scores in both areas.
Descriptive statistics for the independent variables are shown in Table 2. The full sample consisted of the 606 census tracts that were listed as potential dispensary sites in license applications. These neighborhoods exhibited sizeable variation in population density, age dependency ratios, socioeconomic vulnerability, and retail employment shares. Approximately 85% of these census tracts had majority non-Hispanic White populations while two-thirds of the sample contained a K-12 public school within its borders. A matrix of Pearson correlation coefficients indicated that the bivariate correlations among the independent variables were unlikely to be problematic in multivariate analyses.
Estimates of fractional and binary logistic regression models for Total Scores are shown in Table 3. For ease of interpretation, fractional model estimates of average marginal effects are reported as semi-elasticity coefficients. These coefficients are interpreted as the percentage point change in overall application scores associated with a 1% change in a continuous independent variable. Odds ratios are reported for the binary logistic models. The results indicated that neighborhood characteristics affected patterns in scores across census tracts, but they did not alter the odds of attracting a winning dispensary proposal. Neighborhoods with higher population densities tended to attract higher-scoring applicants. On average, a 1% increase in population density was associated with a 1.1% pt. increase in the median score in a census tract. The lowest and highest scores in census tracts also were positively significantly correlated with population density.
Socioeconomic vulnerability was negatively associated with application scores but only in the analysis of minimum scores. The lowest scores in census tracts tended to fall by 2.7% pts. for each 1% increase in the socioeconomic vulnerability index. Additionally, binary logistic models estimated that each 1 pt. rise in the socioeconomic vulnerability index was associated with a 0.8% increase in the odds of attracting a dispensary proposal ranked in the bottom quartile of statewide scores. Racial and ethnic variables also were significantly correlated with application scores. Compared to majority non-Hispanic White neighborhoods, census tracts with Black or Hispanic majorities were less likely to attract a dispensary proposal that scored in the top 25% of the statewide pool. In contrast, scores tended to be higher in neighborhoods where the portions of White, Black, and Hispanic residents were each below a 50% majority.
When fractional logistic models were used to assess scores in each category of the dispensary application, neighborhood characteristics appeared to affect some categories more than others. Table 4 displays model estimates for the five categories that had continuous distributions of scores. Population density was positively associated with the median score within a census tract on the Dispensary Supplement, Business Plan, and Security categories. Median scores in census tracts with no racial or ethnic majority also were higher on the Dispensary Supplement and Business Plan sections as well as the Economic Impact category. No neighborhood-level variables were related to median scores for the Character category.
Neighborhood characteristics also appeared relevant in attracting applicants from the bottom quartile of statewide category scores. Binary logistic models for attracting at least one application from the bottom quartile of a category are provided in Table 5. On average, there was a lower likelihood of attracting low performers on the Dispensary Supplement among census tracts with higher population densities, larger age dependency ratios, and better socioeconomic conditions. Poorer socioeconomic conditions tended to attract low performers on the Dispensary Supplement, Business Plan, and Security categories, but not the Economic Impact or Character categories. The only variable with a statistically significant relationship with outcomes in the Character category was the age dependency ratio, which was inversely related to attracting a low-scoring applicant. A neighborhood’s racial and ethnic composition also exhibited significant effects for some categories. Black and Hispanic neighborhoods had 53.5% lower odds of attracting low performers on the Economic Impact. Neighborhoods with no majority group among residents had lower odds of attracting low performers on the Business Plan section by a magnitude of 59.1%.
Since most applicants received perfect scores of 100% on the Experience and Competition sections, columns 6 and 7 of Table 5 report estimates for logistic models that used a different indicator of a low-performing applicant. Instead of the bottom quartile, the dependent variable equaled “1” if at least one dispensary proposal in a census tract did not receive a perfect category score. According to the results, densely populated communities were less likely to attract a site proposal that lacked a perfect score on the Experience section. This finding suggests that medical dispensary applicants were more likely to target sites in densely populated areas when the principal owners possessed more relevant experience in the legal cannabis market. Meanwhile, socioeconomic vulnerability made census tracts more likely to attract applicants without perfect Competition scores. Lower scores in this category indicated that applicants exhibited a lower aptitude for being able to compete with other dispensaries. Compared to more prosperous areas, poorer census tracts tended to attract businesses with weaker signals of their ability to compete.
In Table 6, binary logistic models were estimated for attracting applicants from the top quartile of each category, which can be seen in columns 1 through 5. Compared to the findings for the bottom quartile, local characteristics were less effective in explaining location patterns among high-scoring applicants. The models were statistically insignificant for all categories except for the Business Plan category. In the Business Plan model, top-quartile applicants only appeared to prefer densely populated communities as sites for their proposed dispensaries. The other independent variables had no effect on attracting top applicants. Column 6 displays results of a binary logistic regression model indicating whether any applicant from the census tract was approved for a license. For each of the neighborhood characteristics, the estimated effects on the odds of receiving a license were statistically insignificant.


