


The holistic effects of medical cannabis compared to opioids on pain experience in Finnish patients with chronic pain | Journal of Cannabis Research
The participants (N = 201) were divided into two groups, MC users (n = 40) and opioid users (n = 161), based on which medicine they selected for evaluation in the experience questions. In the MC group, 18 (45%) reported also using opioids for their pain, and in the opioid group seven (4.3%) reported also using MC for their pain. Of the MC users, 29 (73%) reported having used MC during the last week, and in the opioid group 149 (93%) had used opioids during the last week. Moreover, of the MC users, 12 (30%) reported having used opioids during the last week, and of the opioid users two (1.2%) reported having used MC during the last week. In the opioid group 157 (99%) had an active prescription for the medicine and only one person had a discontinued prescription (prescription information was missing from three participants). By contrast, in the MC group only 10/40 (25%) had an active prescription, 11/40 (27.5%) had a discontinued prescription, and 17/40 (42.5%) had never had a prescription (prescription information was missing from two participants). We included in the study even the MC patients without prescription, given the substantial practical difficulties in getting prescription for MC in Finland (see Discussion). In the MC group, 37/40 (93%) had a diagnosis and in the opioid group 159/161 (99%); this difference was significant in frequentist analyses but not supported by the Bayesian analysis (cross-tabulation BF10 = 1/1.6, χ2 = 5.17, p = 0.023). Demographic information and pain type with tests of group differences are described in Table 1.
In the opioid group, 77 (48%) reported using a weak opioid (e.g., codeine or tramadol), 32 (20%) used a medium strength opioid (e.g., buprenorphine), and 50 (31%) used strong opioids (e.g., fentanyl or oxycodone), and data was missing for 2 cases. 149 (93%) reported using opioids within the last week, and total lifetime duration of opioid use was on average 7.12 years (SD = 6.28). Opioids were used in this group on average 9.50 times a week (SD = 6.59). However, weekly use data may not be reliable, as several patients reported using the medicine “continuously” (e.g., as transdermal patch) and these cases were coded as “7 times a week”. The average Morphine Equivalent Dose (MED) was 41.34 mg (SD = 37.67, range = 2 – 210), however missingness was n = 61 due to limited details about the type of opioid and use frequency which made it impossible to reliably calculate the MED for these participants.
In the MC group, 18 (45%) reported using Bedrocan, 1 (2.5%) used Bediol, 9 (22.5%) used some other type of specified cannabis flower, and 10 (25%) reported that they did not know the type of the cannabis they used. 29 (73%) had used MC during the last week. As to the ratio of THC and CBD, 24 (60%) reported that their medicine was THC-dominant, 7 (18%) reported balanced, and 2 (5%) reported CBD-dominant, whereas 5 (13%) did not know this information. Lifetime duration of MC use was on average 7.46 years (SD = 5.87) and average weekly use was 19.76 times (SD = 19.36). Average single dose was 0.65 g (SD = 1.01; range 0.01—5 g). As a method of use, 16 (40%) reported vaporizing, 12 (30%) reported smoking, 6 (15%) reported eating, and 4 (10%) reported “other” (e.g., tea, oil, or combined methods).
Factor analysis of the pain experience questions
The Kaiser–Meyer–Olkin (KMO) measure of sampling adequacy was excellent (0.93) and Bartlett’s test of sphericity was passed (χ2 = 7519, df = 990, p < 0.001). Based on the scree plot, four factors were extracted. Before proceeding in the analysis, we examined the factor structure for face validity. The fourth factor included only two items (i.e., item 34, “The medicine causes hallucinations” and item 36, “The medicine makes me paranoid”) and was thus omitted. A three-factor analysis was then run without these two questions and the model explained 56% of the variance. Next, 13 problematic items were deleted due to violating the 0.40—0.30—0.20 rule (see Method). Reliabilities in terms of Cronbach’s alphas were 0.93, 0.87, and 0.90 for the three factors respectively, indicating good-to-excellent reliability. The final 30 items and their factor loadings are presented in Table 2.
We determined that the first factor (13 items) included negative side effects, including cognitive disturbances, emotional problems, as well as functional and somatic problems. This factor was titled “Negative Side Effects”. The second factor (7 items) mainly consisted of positive emotional effects and was titled “Positive Emotional Effects”. The third factor (10 items) consisted of a broader range of positive effects: The factor was driven by the items 9 and 8 about pain intensity and pain tolerance, but also consisted of holistic and functional items such as “Focus on other things” (item 11), “Improves life quality” (item 4), “Regain normality” (item 2), “Regain control” (item 5), “Take care of myself” (item 15), and “Attention to sensation” (item 12) (see Table 2). This factor was titled “Positive Holistic Effects”. The questions were averaged to gain factor scores.
Group comparisons
Before comparing the perceived effects of the medicine between the groups, matching was conducted for the relevant covariates (see Methods). Data was missing about the duration of pain for ten participants (one in MC group and nine in the opioid group) and was imputed by the respective group means. Moreover, education data was missing from six participants in the opioid group and was imputed with the respective group mode two (corresponding to vocational school). We removed cases that reported as gender “other” or did not disclose this information (five in the opioid group and one in the MC group) due to an unreliably small number of observations. The matched data (n = 39 in both groups) showed overall better balance than the unmatched sample, although some of the covariates were still above the recommended threshold value of 0.1 (see Fig. 1) (Stuart, Lee, & Leacy 2013). However, since no matching method yielded perfect balance and all the standardized mean differences for individual predictors were < 0.2, we proceeded to the main analysis.

Comparison of the matched vs. non-matched groups on the covariates. Although no ideal match was attained on all covariates, the match between the groups was substantially improved. Note: The standardized mean difference (SMD) indicates the extent to which the groups differ on a given covariate; smaller values are desired. The highlighted vertical line at .1 indicates the recommended maximum SMD. For information regarding how the background variables were assessed, see Table 1
The groups (n = 39 each) were compared regarding their perceived effects of the medicine (MC or opioids) using the averaged factor scores. In terms of Bonferroni-corrected p-value, the MC group showed higher scores on Positive Emotional and Holistic Effects, but no difference in Negative Effects. This was supported by the Bayes Factor, indicating decisive evidence (BF10 > 100) for more Positive Emotional Effects in the MC group, strong evidence (BF10 > 10) for more Positive Holistic Effects in the MC group, but only anecdotal evidence (BF10 < 3) of less Negative Side Effects in the MC group. The standardized effect size was large (0.71) for Positive Emotional and medium (0.47) for Positive Holistic. The results are summarized in Table 3 and Fig. 2. Regarding the perceived efficacy of MC and opioids in reducing pain intensity, the average rating to the intensity-related items 9 and 10 was 5.91 (SD = 0.87) in the MC group and 5.39 (SD = 1.31) in the opioid group (range from 1 to 7), with no group difference (W = 586.50, p = 0.078, BF10 = 1.19).

Raincloud plots of the group differences in the three factor scores, indicating most pronounced differences in Positive emotional effects, with higher ratings in the medical cannabis (MC) group. Note: The range in each factor is from 1 to 7, calculated as average to the respective experience questions which were rated on a 7-point Likert scale from “Completely of the opposite opinion” to “Completely of the same opinion”
As an additional group comparison, we examined if there is group difference in the average rating to the items 34 and 36 tapping on psychotic symptoms which were omitted from the factor analysis (see above). No group difference was observed (W = 657.00, BF10 = 0.39, p = 0.15).
To see whether the group difference was larger for Positive Emotional Effects than for Positive Holistic Effects, we ran repeated measures ANOVA with the positive effect type (Emotional vs. Holistic) as the repeated factor, which showed an interaction with group and the factor type (F = 35.39, p = 7.74E-8, BFincl > 100). That is, the group difference was larger for Positive Emotional Effects than for Positive Holistic Effects. Finally, to get a deeper insight into the experienced differences between the two medications, we conducted a non-planned analysis of the differences between the matched groups in ratings to all the questions from the final factor solution, summarized as a forest plot in Fig. 3. All items with means and standard deviations for the matched groups are summarized in Table 4.
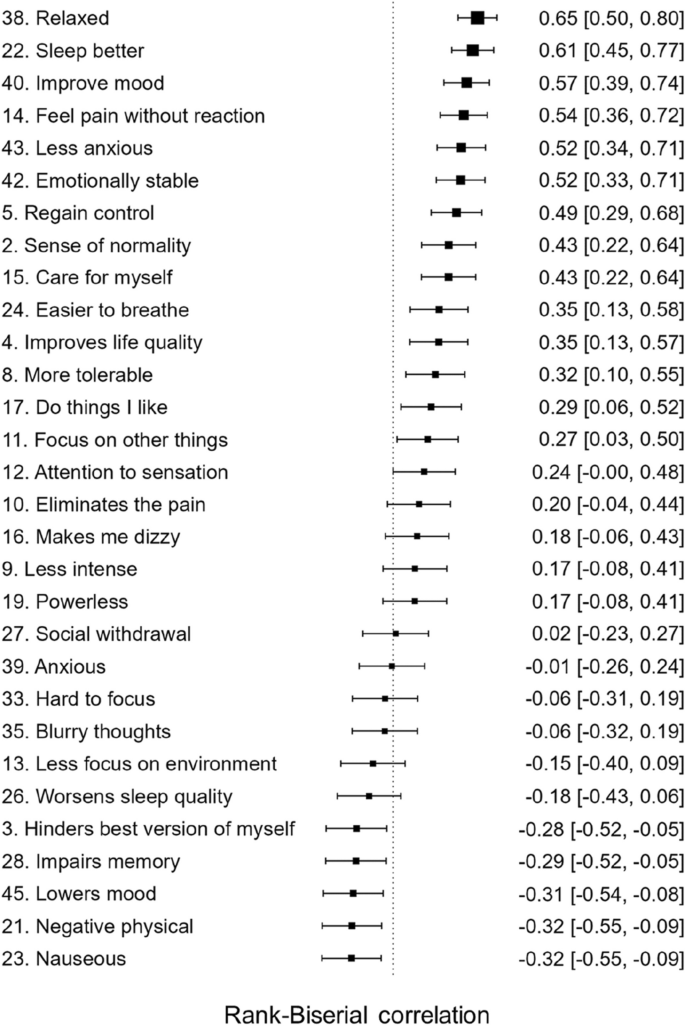
Explorative between-group comparisons of all the variables included in the final factor model, ordered by standardized effect size (Rank Biserial Correlation) from largest to smallest. Note: Larger effect size indicates higher rating in the medical cannabis group. Full item descriptions as well as group means and standard deviations for all the items can be found in Table 4. Items where the confidence interval does not overlap with the vertical line can be considered as significant
It could be argued that recent opioid use in the MC group and recent MC use in the opioid group is a confounding factor in the analysis. Thus, a post hoc analysis was run to investigate whether the main group effects remain after excluding those in the groups who had used the other medication (i.e., MC in the opioid group or opioids in the MC group) during the last week. Two in the opioid group and 12 in the MC group were thus excluded, resulting in sample sizes of n = 37 and n = 27, respectively. In line with the main analysis, this comparison showed that the two groups did not differ in terms of negative side effects (W = 584, BF10 = 0.58, pB = 0.77), but that the MC group showed higher ratings on the factors Positive Emotional (W = 135, BF10 = 542, pB = 2.11E-06) and Positive Holistic (W = 281, BF10 = 12, pB = 0.006).